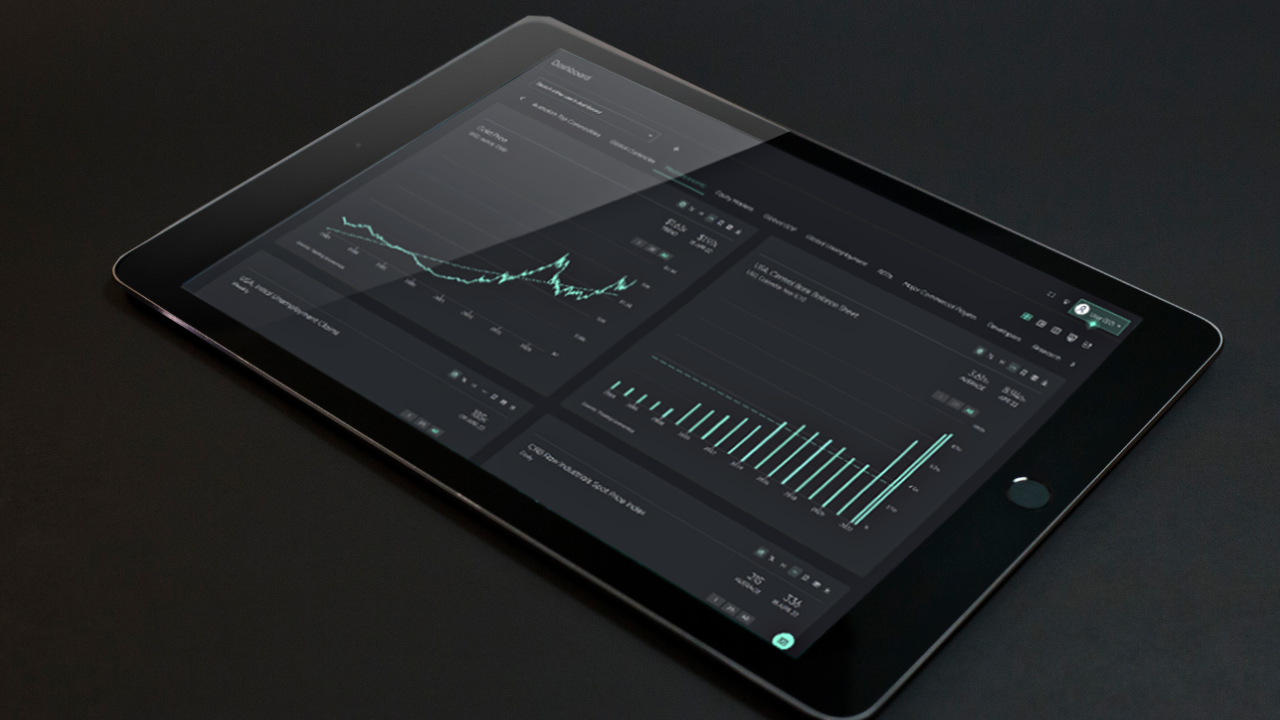
As the commercial real estate industry becomes more data-driven, commercial landlords and investors need to have access to the right tools and analytics to remain competitive in the market. One such tool that is becoming increasingly popular is data visualisation.
Data visualisation is the graphical representation of data and information, which allows complex data sets to be presented in an easily understandable way. By using data visualisation tools to support business strategies, commercial landlords and investors can gain valuable insights into their properties and portfolios, to turn data into decisions.
One of the primary benefits of data visualisation tools is their ability to identify trends and patterns in data. By presenting data in a visual format, it becomes much easier to spot trends and patterns that may not be apparent when looking at raw data. For instance, data visualisation tools like Leaseinfo can be used to identify trends in shopping centre rental rates, rent commencement, expiry date and escalations, and expiry profiles. This information can then be used to make informed decisions about pricing and marketing strategies, which can ultimately lead to increased profitability.
Another significant benefit of data visualisation tools is their ability to identify areas of opportunity for landlords and investors. By analysing the performance of different properties within a portfolio, a data visualisation tool like Dealflow, could reveal that certain properties are performing significantly better than others. This information can then be used to make decisions to invest more heavily in those properties, which can lead to higher returns on investment.
Analytics also play a crucial role in the commercial real estate industry in Australia. Analytics refers to the process of using data to identify patterns and make predictions.
One of the key benefits of analytics is the ability to identify potential risks. By analysing market and sector data, it is possible to identify patterns that may indicate a risk to investment opportunities or suburb selection. This information can then be used to take proactive measures to mitigate those risks, which can ultimately lead to cost savings and reduced liability.
Data visualisation tools and analytics are essential for commercial landlords and investors who want to stay ahead of the competition. By using these tools, landlords and investors can gain valuable insights into their properties and portfolios, which can help them make informed decisions about their investments. Whether it’s identifying trends, spotting areas of opportunity, or identifying potential risks, tools like FLNT’s suite of products can help commercial landlords and investors to succeed in today’s data-driven real estate market.


